Fun fact about Kwisatz Haderach: Aside from being a legendary guy from Frank Herbert’s work Dune, it actually means “shrinking of the path” in Hebrew. It refers to an ability that a Hasiddic Tzadik (holy man) had: shrinking what is normally a 3-day journey into just 1-day of travel.
What does that even mean when you’re in Victorian times? Well… it looks a lot like working at a printing press.
If you are a respectable person, you’d be a member of a printers’ guild. Printing books. Boring, reliable and informed by 400 years of tradition. After all, a single printed book transmits ideas down the generations.
Taylor shared a link to the online book Design for Real Life – which addresses how to design digital experiences that work for stressful, sensitive and urgent situations.
They’re getting cute and clever. But the context is that they fucked up. That’s not the time to joke around – it’s the time to be contrite and make it right.
My table structure and SELECT query was very simple. The database was going to be used for read-only access, without worrying too much about the integrity of the SQLite file (as it was re-created each day).
The database consisted of:
A “product” list with product name, vendor and brand. 120 thousand rows.
A “raw” time-series table representing the daily price for each product_id. 9 million rows.
A typical SQL query is below. And there was an index on raw.product_id.
SELECT nowtime, vendor, product_id, product_name, brand, current_price, old_price, units, price_per_unit, other
	FROM raw
	INNER JOIN product
	ON raw.product_id = product.id
	WHERE product.product_name LIKE '%bread%' OR product.brand LIKE '%bread%';
The problem
On my shared hosting, the query took a whopping 40 seconds to return the same results on the first run. If you re-ran the query, it took only 8 seconds on the server. On my personal laptop, that query took 198 milliseconds to return 215,000 rows.
Why was the first-time run so slow?
Spoiler: eventually I decreased the runtime of the SELECT + result fetching operation from 40 seconds to 13 seconds with the following pragmas. However, most of the speedup was due to rearranging row data within the SQLite file.
Note: I believe the query_only pragma only helps with proper error reporting, rather than speed of execution. But wanted to include it here just in case.
How to speed up SQLite reads
The problem turned out to be related to the slow hard-drive on my web host, and a phenomenon called a “cold start”.
Concept: the “cold start”
As discussed on this thread, the first time SQLite runs, it stars from a “blank slate” – none of the file data has been loaded into memory yet. So SQLite depends on the operating system to load content from disk to memory.
On the second run, all of that file content from before is still resident in the operating system’s memory cache. So the subsequent queries are much faster than the first. This explains why the first time I ran a query, it took 40s, and the second only took 8s.
The file’s contents go out of the memory cache after some time without access. If you are using CPanel, this phenomenon will appear in the “Resource Usage” page like the picture below. The yellow arrows highlight when an SQLite query is run – the OS loads a big portion of the file into memory and then gradually frees up that memory.
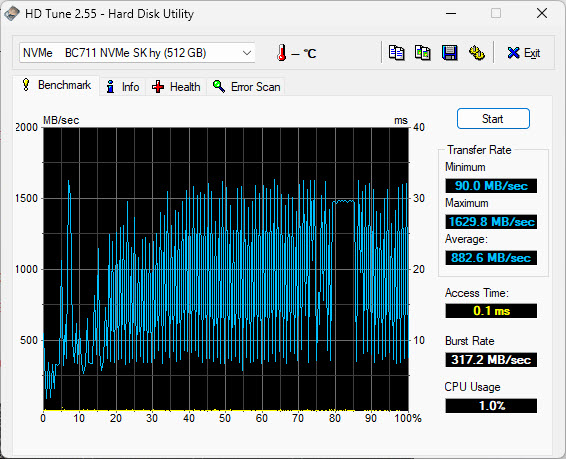
On my laptop’s SSD, the average speed is 882.6MB/sec – 58 times faster than the server.
This difference in hard drive speed explains why the query took so long to return the results on the server: physically seeking and retrieving the result rows took more time because of how slow the server disk was.
This is worth repeating: from benchmarking my application, I could see that the SELECT query was completing quickly (thanks Indexes!) – but the fetcing of the result rows was very time consuming.
Note: your index will take up extra space in the SQLite file. It is like its own table. You can use the sqlite3_analyzer.exe utility program that comes with SQLite in order to see just how much space the Index takes up. Note how an index on an INT field on the RAW table with 8mil rows takes up 16.8% of the entire file by size:
*** Page counts for all tables and indices separately ***
After you’re done creating your index, run the ANALYZE SQL statement. This will update the “query plan” for looking up data to consider the latest available resources. I found that SQLite will quietly ignore the index if you don’t run ANALYZE.
Q: How do I know that SQLite was ignoring the index? A: Run EXPLAIN QUERY PLAN (also addressed in Jason’s writeup about indexes)
What worked for me: rearranging your data on the disk
What ultimately sped up my queries was figuring out in what order SQLite will fetch the result rows for my queries, and to rearrange the data in the file itself so that result rows are likely to be near each other.(This is similar to creating a “Clustered Index” on other SQL engines, but SQLite doesn’t support this feature natively.)
Let me get more specific:
The query I was optimizing was looking for products that contained the word “bread” in their name or brand. Then, it would return any entries from the “raw” table that matched the same products.
The problem with the “raw” table was that it was arranged in chronological order – sorted by the date stamp by default.
Imagine you are the SQLite engine, trying to fetch all rows for product ID 1554. You would use the index to find out where, in the database file, all those entries are located. The first row would’ve been fetched on June 5th, and would be located in the middle of a pack of other product rows that were fetched on that day. To get that one row of data, you’d read an entire “page” (4,096 bytes) from file into memory. After that, the next entry for product 1554 would be found in the middle of a pack of rows fetched on June 6th. You’d fetch a whole bunch of data to get at that 1 row… and repeat and repeat and repeat.
The solution that worked for me was to position all the rows for “product 1554” near each other. To stop storing them in chronological order on disk. That way when you read in the first product entry, that samee block of 4,096 bytes will also contain the next several rows that you’re looking to fetch.
The runtime went from40 seconds to 17 seconds on the first query.
Bonus: how many rows fit within one 4,096 “page” of data? The sqlite3_analyzer.exe program can tell us. On the “raw” table, it shows that an average row takes up 48.48 bytes on disk. So that’s roughly 84 rows that are grabbed in a single disk “read” operation.
Rearrange the column order within a row
If you are storing large amounts of data in each row – close to the “page” size of 4Kb – then you might benefit from rearranging column order within your table definitiion.
That’s because you might be hitting a situation where fetching a single row requires more than 1 disk read operation. In those cases, a second (or third) read operation happens in order to get the full record. If your row contains several short “metadata” columns and a big “content” column, then it’s better to have those fields defined first – an SQL query might get the needed metadata in the first “page” and avoid reading all the pages that represent 1 row.
The page size is a kind of “block” unit in which SQLite stores rows within it’s file. Just like your filesystem’s block size. My understanding is that the SQLite page size should be equal to your filesystem’s block size.
To figure out the filesystem block size, try running stat -fc %s .
If you’re creating the SQLite file on one operating system but using it on a server that runs another, there’s a chance that they could have different default block sizes. In that case, you’ll need to set the block_size to match your <target> system.
The page_size pragma applies at DB creation time. After running it, you need to run VACUUM immediately after for your change to register.
Try: opening the SQLite file in immutable mode
When you open an SQLite file, you can specify a variety of “URI parameters” that change the way the file is treated. In Python, this looks like:
If your app uses the SQLite file for read only operations, you can try opening the file with the immutable=1 parameter. “Immutable” means that your app will not modify the SQLite file and assumes that neither will any other process. Immutable mode will cause the file to be opened in read-only mode, and SQLite will not attempt to lock the file when accessing – which will speed things up if your app is under heavy use. If, for some reason, someone does write to the DB file, it’ll cause an error or corruption.
SQLite creates temporary tables, indices, triggers, and views as part of regular query execution. In case that your DB is configured to write these to disk, you can set PRAGMA temp_store=2 in order explicitly create them in-memory only.
SQLite has a “rollback journal” – a journal is a special file that’s used to undo partial transactions during a crash, and prevents database corruption. By default, SQLite creates a separate file for this journal.
For my read-only / high-tolerance for DB corruption use case, it made sense to turn off journaling completely with the PRAGMA journal_mode=OFF statement. This shaved another second from my sample query’s runtime.
It sounds like this setting only affects write operations. But, my understanding is that any journaling transactions – even “read” transactions – will cause a write to disk. I think it’s implicit in this transaction doc, when it says:
While a read transaction is active, any changes to the database that are implemented by separate database connections will not be seen by the database connection that started the read transaction.
You’d turn off synchronous mode with PRAGMA synchronous=OFF. This setting stands to significantly speed up writes to your SQLite file, but at the risk of DB corruption (ie. an OS-level crash or a power outage).
Try: memory-mapped IO
Memory-mapped IO is a technique to seamlessly load your SQLite file into memory, and to perform regular file operations on it (except it is much faster because it is in-memory). Behind the scenes, this eliminates a memory-copy operation when reading. When writing, this doesn’t save you any cycles.
Memory mapping can be turned on with the below pragma (set it to a large number of bytes, and the OS will allocate just whatever is available):
For my use case, the impact of memory mapping was inconclusive – it either saved 3 seconds or added ~10 seconds to the runtime. I think it’s because mmap still requires reading a lot of data from the slow disk. Test it out on your own system. I ended up using it as part of my final “winning mix” of pragmas.
The sync mode for SQLite determines if SQLite makes sure that data/transactions have been actually written to disk before proceeding with the next operation. The options are described here.
With a read-only use case, I felt comfortable turning off the synch completely:
PRAGMA synchronous=OFF
This hands off any “writes” to the operating system without waiting for them to complete, and should speed things up considerably. Note that even read operations may end up writing to the filesystem.
I did it and it added 10seconds to runtime, so the mmap measurement was off somehow – maybe some stuff was still in disk cache memory…
Actually – test turningn OFF the memory mapping. It seems to have added a lot of execution time in span 34. Maybe it slows stuff down?
If you are doing heavy LIKE searches, look into the case-insensitive GLOB alternative and the COLLATE NOCASE keyword you can use in column definitions / individual queries. For case insensitive matches, lowercasing your data and doing a GLOB case-sensitive match will probably be faster than using LIKE with mixed case values.
Reminder: time your code
If your Python application is slow, use the time.time() function to determine how long different parts of your code take to run.
You might be looking in the wrong place for those slow-code areas.
At first, I was trying to figure out why csv.writerows is so slow on the first Flask run. Then I was thinking the problem was with io.stringio(), and tried to fid a way to preallocate memory to io.stringio(). Finally, I thought that the csv.writerows() code is too slow and started comparing python’s csv module performance to dataframe writing csv.
Eventually, by timing different portions of my code, and removing the “csv conversion” code (while keeping the SQLite fetchall() ), I narrowed the slowness down to SQLite’s row-fetching functionality.
Bonus: VACUUM
Is your SQLite file big and chunky?
Does it need to go on a diet?
SQLite has a behaviour that keeps your database file growing until you run the VACUUM command:
Frequent inserts, updates, and deletes can cause the database file to become fragmented – where data for a single table or index is scattered around the database file.
When content is deleted from an SQLite database, the content is not usually erased but rather the space used to hold the content is marked as being available for reuse.
Once you VACUUM your file, it is smaller, and reading from it should be faster.
Did this help with your project? If so, drop me a line at jacob at this website go give me the warm fuzzies!
The old Mailchimp blog had several classic articles about email. These articles were data driven, and many were written by the fantastic John Foreman (whose book and talk I recommend).
These articles were scrubbed from the Internet. So here they are again, for private reference:
John Foreman
A Purchased List is a Dead List
Jul 24, 2014 MailChimp prohibits using purchased, rented, or scraped email lists, which are now illegal in Canada under CASL and violate their acceptable use policy. Such lists perform poorly, leading to low engagement and high complaint rates.
AOL and Hotmail Users Spend More than Gmail Users, and Other Research Finds
Jan 8, 2013 MailChimp’s 2012 research highlights reveal that Hotmail users tend to spend more than Gmail users, likely due to an older demographic with more disposable income. Additionally, daily deals emails have low engagement but also low unsubscribe and abuse rates, while purchased email lists result in significantly higher complaint rates, leading to potential ISP blocks.
Comacast and Gmai: all your typo email are belong to us
Dec 20, 2011 Typos in email addresses, especially in domains, can lead to successful delivery to typosquatting sites, which may result in security risks or misuse of your content. It’s crucial to watch for these errors and consider using double opt-in to ensure list quality.
Competing with the World Cup for Subscribers’ Attention
Jul 9, 2014 The 2014 World Cup significantly impacted email marketing engagement, with noticeable drops in activity during games and peaks before and after matches. Marketers should consider their subscribers’ time zones and avoid sending important campaigns during major events to maintain engagement.
Detecting Click Clusters in Your Data Using Spreadsheet Math
May 15, 2013 Most people segment their email lists based on predefined criteria, but there’s potential in allowing the computer to analyze data and suggest segments based on subscriber clicks. By employing data mining and unsupervised learning, we can uncover new insights and optimize our email marketing strategies.
Digging Deeper into Wavelength and EGP Data: Finding Interest Clusters in MailChimp’s Network
Oct 23, 2012 MailChimp’s Wavelength tool analyzes subscriber data to identify interest clusters among users, enhancing targeted marketing efforts. By employing cosine similarity calculations, it reveals how closely related different subscribers are, uncovering unique audience segments and insights for improved engagement strategies.
Effect of Social Networks on Email Engagement
Feb 22, 2011 The article discusses how social networks can enhance email engagement, emphasizing the importance of diverse content sharing on platforms like Twitter and Facebook. Research indicates that incorporating social elements in emails can lead to increased engagement, suggesting that marketers can effectively blend email and social strategies for better results.
Fun with Data Science
Dec 7, 2011 The article introduces John, a data scientist at MailChimp, who analyzes email campaign performance through geographic distribution using advanced algorithms like clustering and dendrograms. His findings reveal significant insights on list performance, such as the correlation between subscriber locations and bounce rates, as well as the benefits of utilizing newer email domains for better engagement and deliverability.
How Gmail Tabs Affect Your Email Marketing: An Update
Dec 12, 2013 The article discusses the impact of Gmail’s tabbed inbox on email marketing, revealing that while open rates have decreased significantly for Gmail users, the system appears to help users manage their inboxes effectively, as unsubscribe rates remain stable. Additionally, it highlights variations across industries, suggesting that marketers may need to adjust strategies to engage subscribers better.
Inactive Subscribers are Still Valuable Customers
Feb 9, 2016 The article emphasizes that inactive subscribers, while not actively engaging with emails, still hold significant value for businesses. They contribute to revenue, purchase more frequently, and are less likely to churn compared to non-subscribers, suggesting that businesses should focus on re-engagement strategies rather than removing them from email lists.
Insights from MailChimp’s Send Time Optimization System
Jul 14, 2014 The article discusses MailChimp’s Send Time Optimization (STO) feature, which recommends optimal sending times for email campaigns based on individual engagement data. It highlights key insights such as weekdays being preferable for sending, a peak time of 10 AM, and the importance of understanding the audience’s characteristics, like age and occupation, for effective email timing.
Introducing Hairball v2: Hairball with a Vengeance
Apr 9, 2012 The article introduces Hairball v2, an updated version of the Adobe Air application designed for complex list segmentation in MailChimp, allowing users to perform advanced analysis of campaign performance and recipient engagement. Key features include improved segmentation based on historical data, performance comparison, and more precise filtering of click data to enhance targeted marketing efforts.
Introducing Wavelength
Jan 18, 2012 Introducing “Wavelength,” a MailChimp service designed to help users find similar publishers by analyzing their email lists. It emphasizes the importance of building organic, permission-based email lists instead of purchasing them and outlines how Wavelength can connect users with relevant newsletters based on subscriber overlap.
MailChimp’s Email Genome Project
Feb 9, 2011 The MailChimp Email Genome Project aims to analyze user data to improve email marketing effectiveness and deliverability. By examining patterns from millions of subscribers and emails sent daily, MailChimp seeks to address common dilemmas in email marketing and prevent abuse of the email ecosystem.
Multivariate Testing for MailChimp Pro
Sep 17, 2015 The article discusses MailChimp’s new Multivariate Testing feature, which allows users to test up to eight different elements of an email simultaneously to enhance customer engagement and marketing strategies. It emphasizes the importance of data-driven decisions and provides insights into effective testing practices and reporting metrics to optimize email campaigns.
Project Omnivore: Declassified
Jan 27, 2010 MailChimp’s Project Omnivore, initiated in late 2008, aimed to create a scalable tool to detect spam, particularly from well-meaning marketers unaware they’re spamming. By utilizing advanced genetic optimization techniques and massive data analysis, Omnivore assesses email campaigns and user behavior, sending warnings or suspending accounts for suspicious activities, while still relying on human review for final decisions.
Project Omnivore: Three Years of Gorging on Data
Nov 13, 2012 This article discusses Project Omnivore, which MailChimp launched to monitor and analyze email list quality and sender behavior. By utilizing an AI model that evaluates email addresses based on extensive historical data, Omnivore helps ensure a healthier email ecosystem while allowing legitimate users to send emails without unnecessary barriers.
Research: Spammy Email Design Mistakes
Oct 13, 2010 The article discusses an experiment by MailChimp that analyzed email campaigns flagged as spam by reviewers from Amazon’s Mechanical Turk. It identifies common design mistakes that lead to false positives, such as overly sales-oriented text, poor layout, and reliance on stock templates, ultimately providing insights into effective email marketing design.
Send Time Optimization in MailChimp
Dec 3, 2013 This HTML document outlines the “Send Time Optimization” feature introduced by MailChimp, which helps users identify the best times to send emails based on subscriber engagement data. The optimization takes into account global email engagement trends and specific subscriber history to improve click-through rates, particularly focusing on the most engaged audience segments.
Sending Frequency: More Is Not Always Better!
Apr 23, 2013 This article discusses the misconception that sending more emails leads to greater engagement and revenue. It emphasizes that increased email frequency negatively correlates with engagement per campaign, suggesting an optimal sending frequency to maximize total clicks rather than simply increasing volume.
Smarter Bounce Management Rules with Engagement
Sep 1, 2010 The article discusses the challenges of managing email bounces for Email Service Providers (ESPs), emphasizing the distinction between hard and soft bounces and the complications that arise from server errors and deceptive bounce messages. It highlights the importance of effective bounce management for maintaining domain reputation and outlines MailChimp’s strategy of incorporating engagement metrics into bounce cleaning decisions to improve deliverability and list management.
Subject Line Data: Choose Your Words Wisely
Nov 13, 2013 This article analyzes the impact of subject line wording on email open rates, revealing that even a single word can significantly affect engagement. Key findings include the effectiveness of personalization, urgency, and certain keywords, highlighting the importance of choosing words wisely in email campaigns.
Subscriber Engagement Half-Life
Feb 18, 2011 The article discusses findings from Dan Zarrella’s webinar on email marketing, revealing that the average click rate for subscribers significantly drops below 1% after four months. To maintain engagement, marketers must entertain and deliver value quickly while continually attracting new subscribers to offset potential churn.
Subscriber Engagement Over Time
Nov 25, 2013 The article analyzes subscriber engagement over time using extensive data, finding that click rates start above 5% and decline to around 3.5% after multiple campaigns, with differences observed across industries and email domains. It emphasizes the importance of subscriber context and preferences in shaping engagement, recommending strategies like double opt-in to enhance initial interaction levels and maintain interest.
This Just In: Subject Line Length Means Absolutely Nothing
Sep 17, 2012 The article explores the misconception that the length of email subject lines significantly affects open and click rates. Analyzing data from 12 billion emails, it concludes that there is no meaningful correlation between subject line length and engagement, emphasizing the importance of personalized content over gimmicks or strict length guidelines.
Update on Omnivore, new 3 Strikes Rule
Aug 27, 2010 The article provides an update on MailChimp’s Omnivore program, which is designed to combat email abuse by analyzing user behavior and implementing anti-spam measures. It discusses the new “Three Strikes” rule, stating that if any sender is suspended three times within six months, their account will be permanently shut down, aiming to enhance the overall integrity of the email ecosystem.
What Does Your ISP Say About You?
Nov 26, 2013 This article explores how email addresses can reveal insights about individuals, including their likely age and interests based on the email domain used. It analyzes various domains such as Gmail, Hotmail, Yahoo, AOL, and Comcast, showing how different demographic characteristics and preferences can be inferred from users of these services.
What Good Marketers Can Learn from Spammers
Oct 18, 2012 The article discusses what effective marketers can learn from spam emails, specifically highlighting that while spammers often use a single clear call to action and few distractions, marketers should balance word count, image count, and URL count to optimize click rates. The research indicates that campaigns with concise content and relevant links tend to perform better than those with excessive text or images, ultimately suggesting that quality and clarity are key to successful email marketing.
Where Have All the Government Clicks Gone?
Oct 15, 2013 The article discusses the impact of the 2013 U.S. government shutdown on email engagement among government employees, noting a significant drop in interactions from affected agencies. It highlights how the furloughs led to decreased activity, contrasting it with unaffected agencies like the SEC, which saw increased engagement during the fall marketing season.
I used my Linkedin post-saving bookmarklet to export the discussion for posterity. Skyrocketing food prices are a top problem for Canadians at the moment.
Project Hammer aims to drive more competition and reduce collusion in the Canadian grocery sector.
To get this done, we will: 1. Compile a database of historical grocery prices from top grocers’ websites. 2. Make the database available in a format that is suitable for academic analysis and for legal action. 3. Inform changemakers of the existence of this dataset (and make it reasonably easy for them to use).
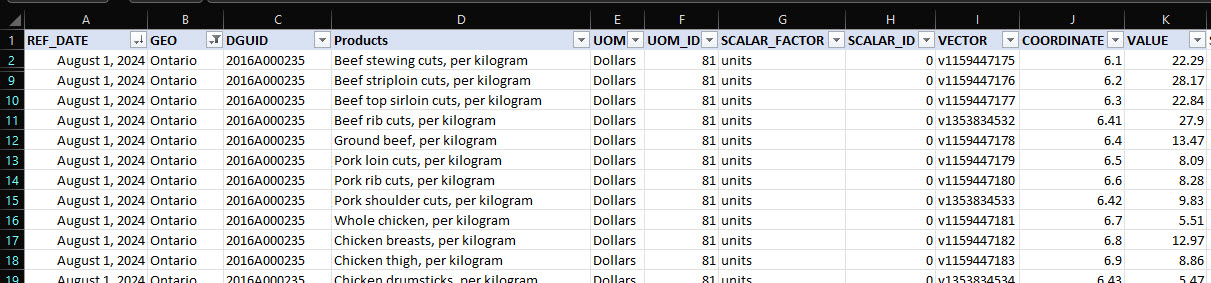
Canadian Grocery Price Data
8 vendors in the dataset: Voila, T&T, Loblaws, No Frills, Metro, Galleria, Walmart and Save-On-Foods. Dates available: from February 28, 2024 to the latest load at
Get Full Data in 2 CSV Files
The “product” file contains metadata and product details. The “raw” file contains time-series price data. Join them on “id” and “product_id” columns.
I can’t do this alone. This project can only succeed with a community of people around it – people like you, who bring their own skills and perspectives to the challenge.
Reach out to me (email “jacob” at this website) if:
You can do economic analysis of pricing data, and especially the interaction/correlation of multiple streams of prices across time
You are skilled with data processing and normalization
You’d play with the data for 1 day and tell me of all the bugs/issues/opportunities you found
You are doing similar pricing work in other countries / you’ve been inspired by Mario Zechner’s work
You are a data-oriented politician, aide, activist, journalist or lawyer who’s interested in improving Canada’s hyper-concentrated grocery sector
When a product goes on "sale", how long has it been since the previous sale? (if something is constantly on sale, then that's just its regular price)
When something's on "sale", did the price get jacked up artificially just ahead of the sale, only to lower it back down to normal?
How are different grocers responding to each other's price moves, on a certain product/category?
Is someone always leading price movements, and the others follow?
Is one retailer always reacting, and never initiates price moves?
Do prices for certain grocers move exactly in tandem?
Do prices move completely at random, with no interaction?
Do prices always rise, and never fall?
Which grocer is generally the cheapest across all comparable product families?
Do prices on certain "bundles of products" always move in tandem, at a single grocer? (think eggs, milk and bread always rising/dropping by similar amounts together)
Notes About the Data
Which grocery vendors' prices are included? Voila, T&T, Loblaws, No Frills, Metro, Galleria, Walmart Canada, Save-On-Foods.
How was the data gathered? This information is from a screen-scrape of website UI - that's why it is missing information that you might get from the internal APIs that power grocers' websites.
Prices are for the "in store pickup" option, as set for a neighbourhood in Toronto.
Is there data for every day and every vendor? No. Between Feb. 28 and July 10/11, I was gathering prices for a "small basket" of products. After that, we have prices for a much larger variety of products. Also, there may be missing data for certain days for certain vendors - days on which those specific extracts failed.
What are the columns in the data?
Table: product Product meta-data like name, vendor (ex. Loblaws), brand and unit size. Is updated only when a new product is discovered (ex. there is a Unit size variation that hasn't been seen before).
Column
Description
id
This is a unique product ID that's being used to join the "product" table to the "raw" table. This ID changes every day and is not a stable unique identifier! Use SKU or UPC instead when referring to a unique product.
concatted
A homebrew "unique identifier" that concatenates vendor,product_name,unit and brand. Used in intermediate steps before the scrape and the final output.
vendor
One of the 8 grocery vendors
product_name
Product name. May include Brand, may include Units in it.
units
Units (grams, kg, number of items in package). May be blank for some vendors/products.
brand
Brand name of the company that made a product (ex. "Frito Lay"), may be empty.
detail_url
"Detailed product listing URL" for this particular product. Used as a way of extracting the SKU and UPC.
sku
Each vendor's own unique identifier for a given product. Extracted from the "detail_url". For Metro, Galleria and Save-On-Foods, the SKU is also the UPC.
upc
The universal, cross-vendor unique product identifier. UPC is very hard to find for products. Most reliable UPC: Metro, Galleria and Save-On-Foods - their UPCs come directly from the vendor website. Next most reliable UPC: Walmart. The Walmart SKU was matched to a UPC figure on a site that I believe is owned by Walmart. These UPC are from exact matches, not fuzzy matches. Least reliable UPC: Loblaws, NoFrills, T&T and Voila. For them, I had to use fuzzy matching to find potential UPCs. I've done a manual Quality Control pass, but there may be incorrect UPCs there - always sanity-check by looking at product_name when comparing across vendors.
Table: raw Product prices at a point-in-time. New data is added every day.
Column
Description
nowtime
Timestamp indicating when the data was gathered
current_price
Price at time of extract
old_price
An "old" struck-out price. This indicates that there was a Sale on. This is how you can differentiate a price-drop advertised as a Sale vs. a "quiet" decrease without a Sale.
price_per_unit
Price per unit, as shown on the vendor website. May not be consistent with real calculation of "current_price" divided by "units". Double check it.
other
Other details that appeared on the listing. Values may be "Out of stock", "SALE", "Best seller", "$5.00 MIN 2"
product_id
This is a unique product ID that's being used to join the "product" table to the "raw" table. This ID changes every day and is not a stable unique identifier! Use SKU or UPC instead when referring to a unique product.
CSV file notes The .csv file you get from the form is optimized for Excel. Specifically, it includes a "BOM" - several characters at the start of the file that make Excel treat it as UTF-8. If you're loading the .csv into a different tool for analysis, you may need to remove the BOM.
SQLite file notes
product table: this table contains vendor, product_name, units and brand
raw table: contains the time series price data - nowtime, current_price, old_price, price_per_unit
The two tables are joined using product.id and raw.product_id
To speed things up, there is an index on raw.product_id
Simple example of how you'd grab all product data for the Becel brand. Note that for certain vendors, "Becel" would only be present in product_name, for others - only in the brand:
SELECT nowtime, vendor, product_id, product_name, brand, current_price, old_price, units, price_per_unit, other
	FROM raw
	INNER JOIN product
	ON raw.product_id = product.id
	WHERE product.product_name LIKE '%becel%' OR product.brand LIKE '%becel%';
Here's a more complex example of how you'd grab prices for all Miss Vickie's Original Recipe chips:
SELECT nowtime, vendor, product_id, product_name, brand, current_price, old_price, units, price_per_unit, other
	FROM raw
	INNER JOIN product
	ON raw.product_id = product.id
	WHERE
		(product.product_name LIKE '%original%' AND product.brand LIKE '%miss vick%') OR
		(product.product_name LIKE '%miss vick%original%');
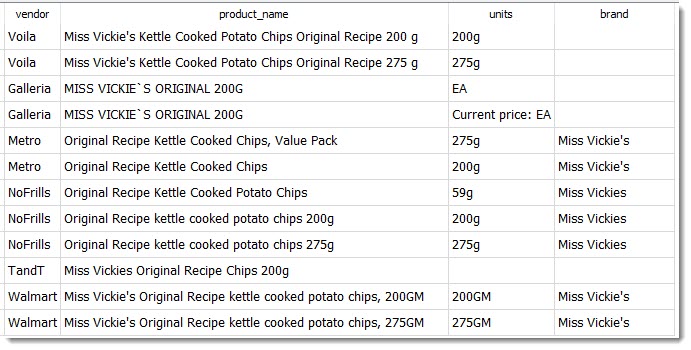
Why does the query say "miss vick"? It's because some grocers represent it as "Miss Vickies", "Miss Vickie's" and some as "Miss Vickie`s" with a weird UTF-8 quote that's not even on your keyboard. "miss vick" matches all of them. Here are the various products from the product table that the above statement will include:
Note how there are 3 distinct products here at different weights: 59g, 200g and 275g. To compare across vendors, you can refine your SQL query further or export to CSV for filtering in Excel.I exported the results of the query above to Excel, kept only the 200g prices, created a PivotChart and got this workable visualization. You can see that Walmart has the lowest prices for Miss Vickies' Original Kettle Chips & the Asian-focused grocers have the highest.
Show the price on June 10 (our first full extract) vs. the same product's price on Sept. 17.
WITH
	startend_diffrows AS (	-- the price at the first date and last date we want is on different rows (so there are 2 rows for a product that's in our DB on both days
		SELECT
			product.*
			, raw.nowtime
			, CASE
					WHEN raw.nowtime LIKE '2024-06-11%' THEN raw.current_price
					END startprice
			, CASE
					WHEN raw.nowtime LIKE '2024-09-17%' THEN raw.current_price
					END endprice
		FROM
			product
		INNER JOIN raw
				ON raw.product_id = product.id
		WHERE
			raw.nowtime LIKE '2024-06-11%' OR raw.nowtime LIKE '2024-09-17%'),
	startend_pivoted AS (	-- group the data so that the data from the 2 rows for our unique product ends up on the same 1 row
		SELECT
			id, vendor, product_name,units,brand, MAX(startprice) AS g_startprice, MAX(endprice) AS g_endprice
			-- note that there may be several rows for the same produt on the same date - because I ran the extract in the morning and late at night on the same date...
		FROM
			startend_diffrows
		GROUP BY id )

	SELECT * FROM startend_pivoted -- now drop any products that weren't present on both days in the range (due to scraping failure etc.)
		WHERE g_startprice NOT NULL AND g_endprice NOT NULL;
Max, Min, Avg and Count for Prices
WITH
	uniquedates AS (
		SELECT DISTINCT
			date(nowtime), current_price, product_id
		FROM
			raw),

	stats AS (
		SELECT
			*, MAX(current_price) as _max, MIN(current_price) as _min, AVG( current_price ) as _avg, COUNT( current_price ) as _count
		FROM
			uniquedates
		GROUP BY
			product_id)

	SELECT
		product.id,product.vendor,product.product_name,product.units,product.brand, stats._max, stats._min, stats._avg, stats._count
	FROM
		stats
	INNER JOIN
		product
	ON stats.product_id = product.id;
Known Issues
What you see: 2 different price points for the same product, scraped on the same day (and sometimes at the same minute) Examples: "100% Natural Origin Moisturizing Lip Balm, Cucumber Mint" and "Melatonin" by Sisu at Loblaws. Cause: 2 distinct products are listed on vendor website with the exact same name and "unit size" Up until Sept. 30, 2024 there is no way to distinguish the two. After that, we have unique "detail_url" and "sku" values that help tell them apart.
What you see: multiple price entries (same price) for the same product on 1 day. Magnitude: about 6,500 products impacted per day (as at Nov. 2, 2024). Examples: "Mexican 4 Cheeze Blend Gluten Free Shreds" by Daiya at Metro. Cause: Sometimes the exact same product appears in the scrape multiple times on the same day. This might be because of a product being listed under multiple categories. Or because the product is being advertised, so it shows up in unrelated categories/stickied on top of page on each page of a category.
Relevant SQL
SELECT product_id, COUNT(product_id) AS mycount FROM raw WHERE nowtime LIKE '2024-10-27%' GROUP BY product_id ORDER BY mycount DESC;
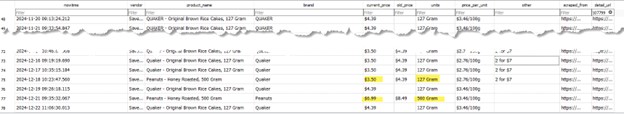
What you see: on the Save-On-Foods extract, some product name + brand combindations are mismatched with the value in detail_url. On extracts up until 2024-12-24 Magnitude: about 9 products a day, out of ~10k products. But each day, it can be a set of different products. Examples: here's an example where the product name doesn't match the units - it indicates that something went wrong:
Cause: an issue during the web-scraping stage. Fixed as of the 2024-12-25 dataset, but not fixed retroactively.
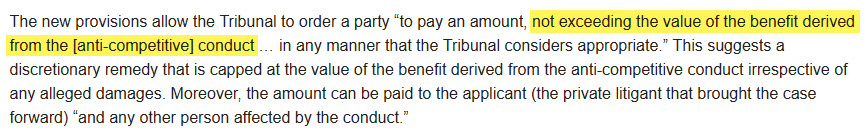
Easier access to the Competition Tribunal is coming on June 20, 2025. But, appalingly, we're limiting the risks of anti-competitive abuses by capping the fines that guilty parties have to pay:
This is a collection of ukio-e prints from the Royal Ontario Museum. It’s called “Album of prints from Manners and Customs of Women” (Fujin fūzoku zukushi 婦人風俗尽).
Credit Line: Gift of Mrs. A. Ledingham in memory of Miss Martha Julia Cartmell, pioneer missionary to Japan
My favourite is the image to the right – “a courtesan departs” – but so many of these are fantastic. For more ukio-e prints, go to https://ukiyo-e.org/ and scroll down the page. For more cool objects from the ROM Digital Collection, click here.
Note from Dec. 8, 2024: In many Japanese prints of courtesans / “pretty women”, the women’s faces are simply drawn while the hair is drawn elaborately. I believe this is telling about the part of the anatomy that men in the 1700s – 1800s cared about. (The prints above aren’t done in that “pinup” style, and that’s a big part of why I like them).
Here’s a small look at how complex women’s hair styles and accessories could get, from this 1885 book:
Note from June 6, 2025: More hair stuff! “Tose Kamoji Hinagata” hair catalogue by the illustrator Abe Gyokuwanshi. From this eBay listing.
What’s a dab o’ the pen ? Weel, a dab o’ the pen Is a very wee thing as ye surely maun ken ; But a deal may be dune to mar or to men’, Wi’ a very sma’ dab o’ a very sma’ pen.
Ye may fasten your friens or embitter your foes, Ye may add to your comforts or fill up your woes, An’ a word in gude season is better than ten That we sometimes let slip wi’ a dab o’ the pen.
By a dab o’ the pen ye may get a gude wife, Or may get ane wha’ll mak’ ye be sick o’ your life ; And its better off-han’ in a way ye suld ken To say a kind word than to tak’ up a pen.
Some tak’ up the pen an’ write to a lass, And say that a minute they canna’ let pass, Withoot dreams o’ their dearie—an’ richt oot comes then, A proposal to marry by dab o’ the pen.
An’ dab comes the pen by return o’ the post, She says that in wonder an’ trouble she’s lost, Sin’ the day she was born she couldno bide men, But noo she’ll be Jamie’s—by a dab o’ the pen.
So last Wednesday my wife is minding her business puttering around in the other room and my son comes in the room and I hear her talking in a low voice and after a while she goes HEY and I hear a plate smash and then the furniture sqreeeking and she’s yelling HEY HEY COME HERE YOU LITTLE and I get up from the computer and I’m walking down the hallway and she’s huffing and yelling I GOT YOU NOW YOU LITTLE SHIT and I’m speeding up and he’s yelling SKREEEEEEE but he’s moving really fast but she’s pinning both his hands(?) with one of hers and she’s huffing now and her black hair is plastered to her forehead with sweat but she’s holding on and her eyes are wild and she says she says: I GOT HIM I GOT HIM and would you look at that! it’s not our son it’s one of them cat demons that dress up and sneak up on you and I NEVER even seen one in real life so I go and make a woodcut print of the whole episode so we can remember and laugh about it later when we sit and sip a yuzu lemonade