
Project Goal
Project Hammer aims to drive more competition and reduce collusion in the Canadian grocery sector.
To get this done, we will:
1. Compile a database of historical grocery prices from top grocers’ websites.
2. Make the database available in a format that is suitable for academic analysis and for legal action.
3. Inform changemakers of the existence of this dataset (and make it reasonably easy for them to use).
Canadian Grocery Price Data
8 vendors in the dataset: Voila, T&T, Loblaws, No Frills, Metro, Galleria, Walmart and Save-On-Foods.
Dates available: from February 28, 2024 to the latest load at
Get Full Data in 2 CSV Files
The “product” file contains metadata and product details. The “raw” file contains time-series price data. Join them on “id” and “product_id” columns.
All Data in a SQLite file
I recommend the free DB Browser software for viewing the SQLite file. It can easily filter the data and export to CSV.
Learn more about the data fields and how the data was gathered.
I Need Your Help
I can’t do this alone. This project can only succeed with a community of people around it – people like you, who bring their own skills and perspectives to the challenge.
Reach out to me (email “jacob” at this website) if:
- You can do economic analysis of pricing data, and especially the interaction/correlation of multiple streams of prices across time
- You are skilled with data processing and normalization
- You’d play with the data for 1 day and tell me of all the bugs/issues/opportunities you found
- You are doing similar pricing work in other countries / you’ve been inspired by Mario Zechner’s work
- You are a data-oriented politician, aide, activist, journalist or lawyer who’s interested in improving Canada’s hyper-concentrated grocery sector

Price Visualizations from the Dataset
Full interactive page for the below visualization
Full interactive page for the below
Research Questions
Here are some ideas to play with when looking at the data:
- Visualize the price of making a standard sandwich at each of the grocers (200g white bread + 20g ham + 20g lettuce...) Which grocer is cheapest?
- Will there be a Nov. 1 to Feb. 5 price freeze on certain products?:
Metro stated that “It is an industry practice to have a price freeze from Nov. 1 to Feb. 5 for all private label and national brand grocery products, and this will be the case in all Metro outlets.” - When a product goes on "sale", how long has it been since the previous sale? (if something is constantly on sale, then that's just its regular price)
- When something's on "sale", did the price get jacked up artificially just ahead of the sale, only to lower it back down to normal?
- How are different grocers responding to each other's price moves, on a certain product/category?
- Is someone always leading price movements, and the others follow?
- Is one retailer always reacting, and never initiates price moves?
- Do prices for certain grocers move exactly in tandem?
- Do prices move completely at random, with no interaction?
- Do prices always rise, and never fall?
- Which grocer is generally the cheapest across all comparable product families?
- Do prices on certain "bundles of products" always move in tandem, at a single grocer? (think eggs, milk and bread always rising/dropping by similar amounts together)
Notes About the Data
Which grocery vendors' prices are included?
Voila, T&T, Loblaws, No Frills, Metro, Galleria, Walmart Canada, Save-On-Foods.
How was the data gathered?
This information is from a screen-scrape of website UI - that's why it is missing information that you might get from the internal APIs that power grocers' websites.
Prices are for the "in store pickup" option, as set for a neighbourhood in Toronto.
Is there data for every day and every vendor?
No. Between Feb. 28 and July 10/11, I was gathering prices for a "small basket" of products. After that, we have prices for a much larger variety of products. Also, there may be missing data for certain days for certain vendors - days on which those specific extracts failed.
What are the columns in the data?
Table: product
Product meta-data like name, vendor (ex. Loblaws), brand and unit size. Is updated only when a new product is discovered (ex. there is a Unit size variation that hasn't been seen before).
| Column | Description |
|---|---|
| id | This is a unique product ID that's being used to join the "product" table to the "raw" table. This ID changes every day and is not a stable unique identifier! Use SKU or UPC instead when referring to a unique product. |
| concatted | A homebrew "unique identifier" that concatenates vendor,product_name,unit and brand. Used in intermediate steps before the scrape and the final output. |
| vendor | One of the 8 grocery vendors |
| product_name | Product name. May include Brand, may include Units in it. |
| units | Units (grams, kg, number of items in package). May be blank for some vendors/products. |
| brand | Brand name of the company that made a product (ex. "Frito Lay"), may be empty. |
| detail_url | "Detailed product listing URL" for this particular product. Used as a way of extracting the SKU and UPC. |
| sku | Each vendor's own unique identifier for a given product. Extracted from the "detail_url". For Metro, Galleria and Save-On-Foods, the SKU is also the UPC. |
| upc | The universal, cross-vendor unique product identifier. UPC is very hard to find for products. Most reliable UPC: Metro, Galleria and Save-On-Foods - their UPCs come directly from the vendor website. Next most reliable UPC: Walmart. The Walmart SKU was matched to a UPC figure on a site that I believe is owned by Walmart. These UPC are from exact matches, not fuzzy matches. Least reliable UPC: Loblaws, NoFrills, T&T and Voila. For them, I had to use fuzzy matching to find potential UPCs. I've done a manual Quality Control pass, but there may be incorrect UPCs there - always sanity-check by looking at product_name when comparing across vendors. |
Table: raw
Product prices at a point-in-time. New data is added every day.
| Column | Description |
|---|---|
| nowtime | Timestamp indicating when the data was gathered |
| current_price | Price at time of extract |
| old_price | An "old" struck-out price. This indicates that there was a Sale on. This is how you can differentiate a price-drop advertised as a Sale vs. a "quiet" decrease without a Sale. |
| price_per_unit | Price per unit, as shown on the vendor website. May not be consistent with real calculation of "current_price" divided by "units". Double check it. |
| other | Other details that appeared on the listing. Values may be "Out of stock", "SALE", "Best seller", "$5.00 MIN 2" |
| product_id | This is a unique product ID that's being used to join the "product" table to the "raw" table. This ID changes every day and is not a stable unique identifier! Use SKU or UPC instead when referring to a unique product. |
CSV file notes
The .csv file you get from the form is optimized for Excel. Specifically, it includes a "BOM" - several characters at the start of the file that make Excel treat it as UTF-8. If you're loading the .csv into a different tool for analysis, you may need to remove the BOM.
SQLite file notes
producttable: this table contains vendor, product_name, units and brandrawtable: contains the time series price data - nowtime, current_price, old_price, price_per_unit- The two tables are joined using
product.idandraw.product_id - To speed things up, there is an index on
raw.product_id
Simple example of how you'd grab all product data for the Becel brand. Note that for certain vendors, "Becel" would only be present in product_name, for others - only in the brand:
SELECT nowtime, vendor, product_id, product_name, brand, current_price, old_price, units, price_per_unit, other
	FROM raw
	INNER JOIN product
	ON raw.product_id = product.id
	WHERE product.product_name LIKE '%becel%' OR product.brand LIKE '%becel%';
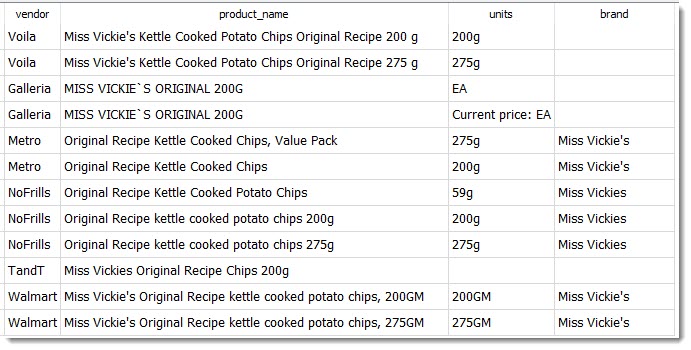
Here's a more complex example of how you'd grab prices for all Miss Vickie's Original Recipe chips:
SELECT nowtime, vendor, product_id, product_name, brand, current_price, old_price, units, price_per_unit, other
	FROM raw
	INNER JOIN product
	ON raw.product_id = product.id
	WHERE
		(product.product_name LIKE '%original%' AND product.brand LIKE '%miss vick%') OR
		(product.product_name LIKE '%miss vick%original%');
Why does the query say "miss vick"?
It's because some grocers represent it as "Miss Vickies", "Miss Vickie's" and some as "Miss Vickie`s" with a weird UTF-8 quote that's not even on your keyboard. "miss vick" matches all of them. Here are the various products from the product table that the above statement will include:
SQL Code for Reference
Dear reader - let me know if sharing code,data & notes in an SQL Notebook like Deepnote would be better.
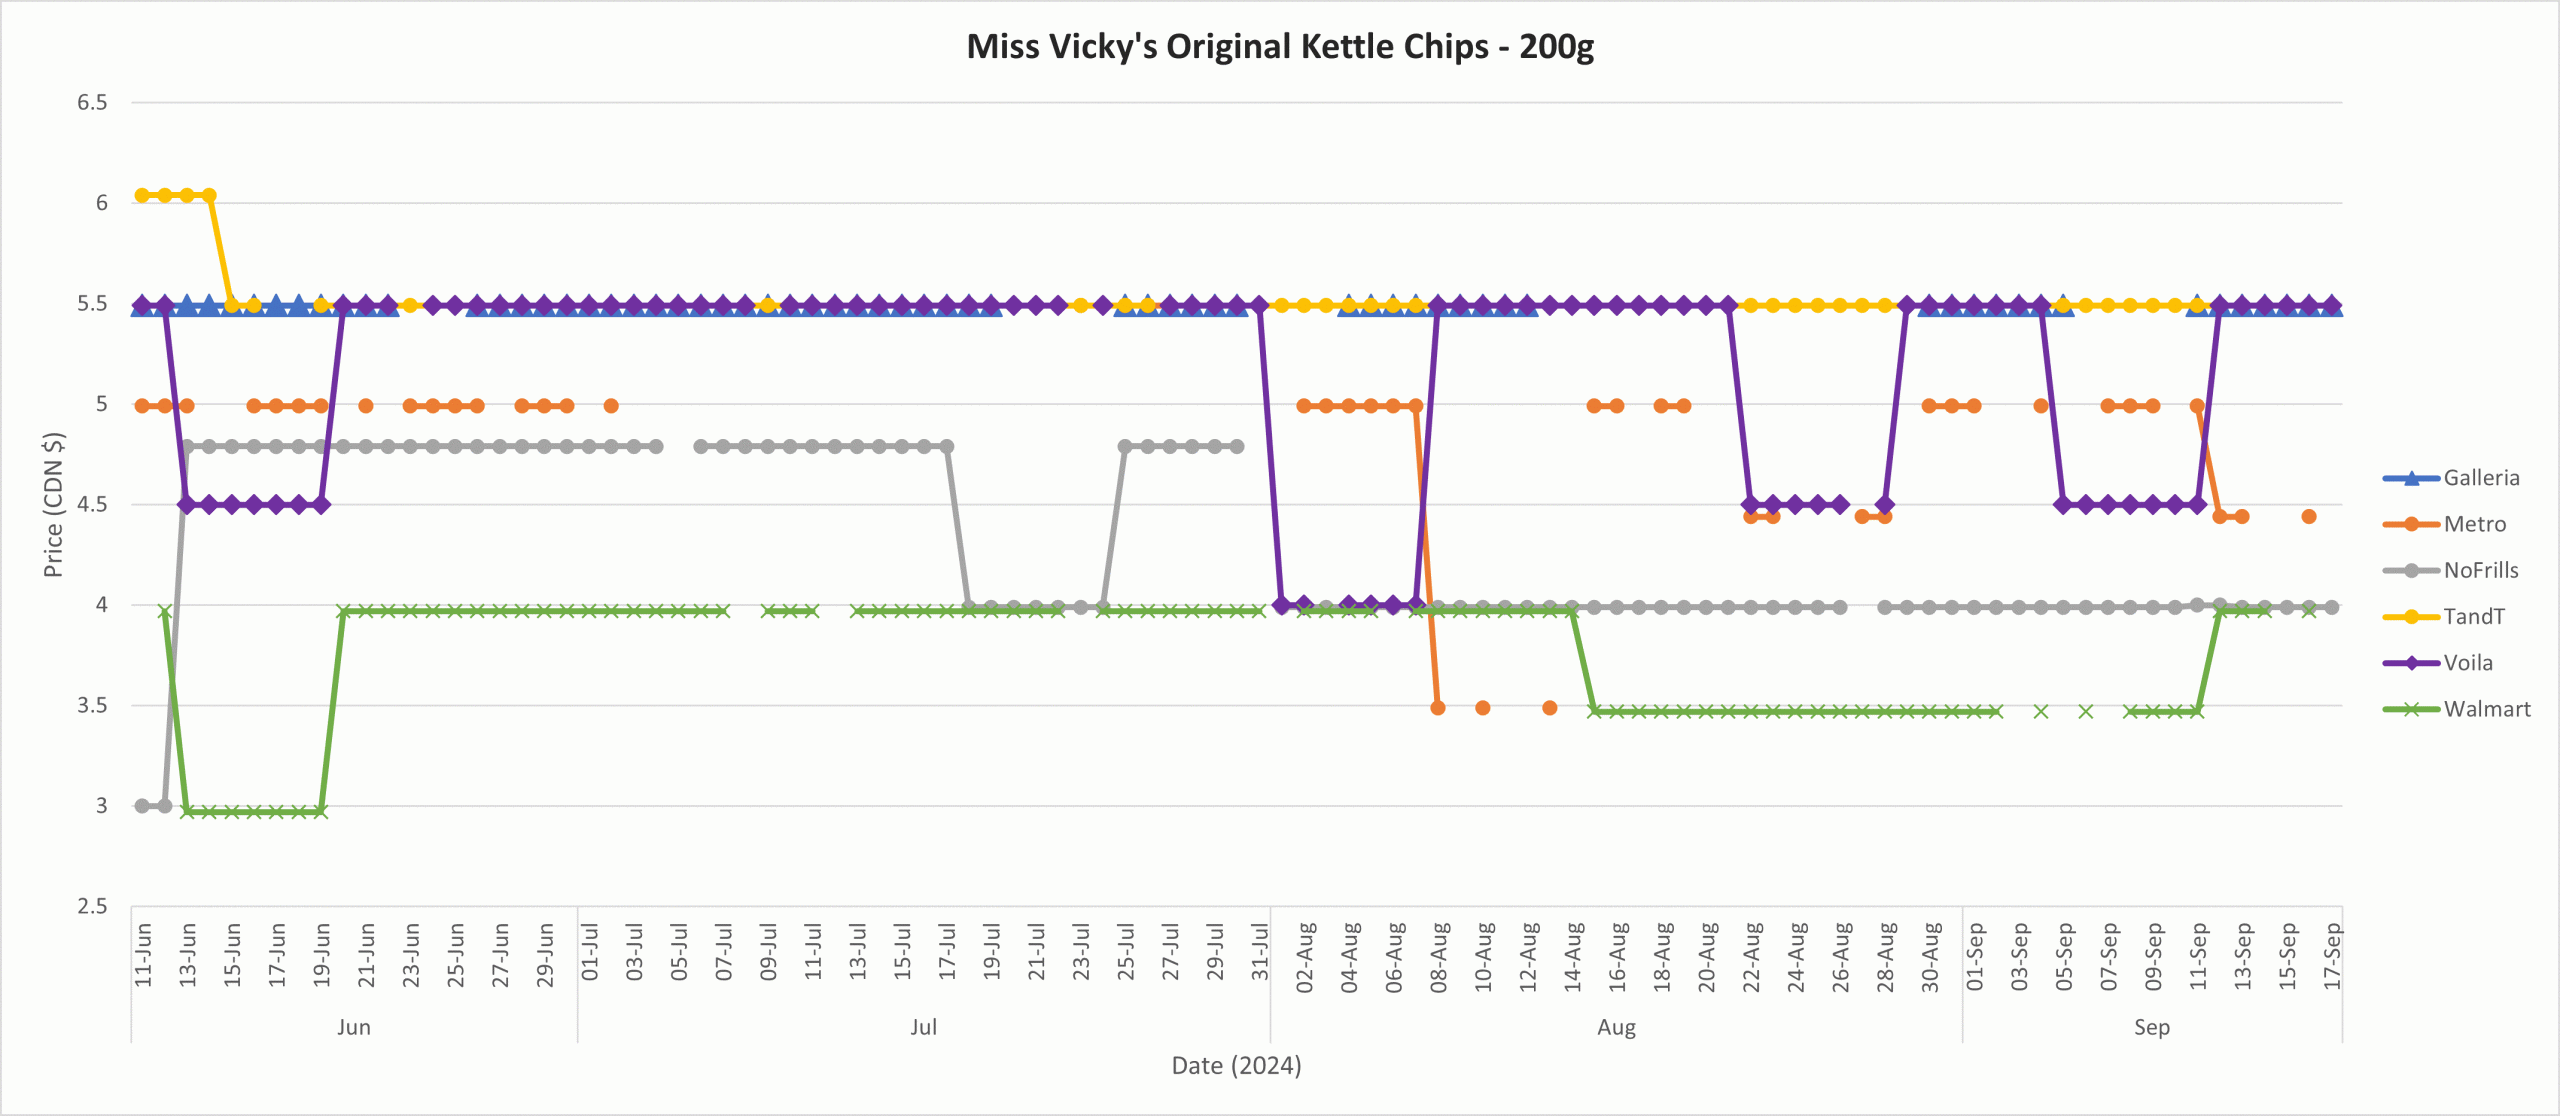
Prices at June 10 vs. Sept. 17
Show the price on June 10 (our first full extract) vs. the same product's price on Sept. 17.
WITH
	startend_diffrows AS (	-- the price at the first date and last date we want is on different rows (so there are 2 rows for a product that's in our DB on both days
		SELECT
			product.*
			, raw.nowtime
			, CASE
					WHEN raw.nowtime LIKE '2024-06-11%' THEN raw.current_price
					END startprice
			, CASE
					WHEN raw.nowtime LIKE '2024-09-17%' THEN raw.current_price
					END endprice
		FROM
			product
		INNER JOIN raw
				ON raw.product_id = product.id
		WHERE
			raw.nowtime LIKE '2024-06-11%' OR raw.nowtime LIKE '2024-09-17%'),
	startend_pivoted AS (	-- group the data so that the data from the 2 rows for our unique product ends up on the same 1 row
		SELECT
			id, vendor, product_name,units,brand, MAX(startprice) AS g_startprice, MAX(endprice) AS g_endprice
			-- note that there may be several rows for the same produt on the same date - because I ran the extract in the morning and late at night on the same date...
		FROM
			startend_diffrows
		GROUP BY id )

	SELECT * FROM startend_pivoted -- now drop any products that weren't present on both days in the range (due to scraping failure etc.)
		WHERE g_startprice NOT NULL AND g_endprice NOT NULL;
Max, Min, Avg and Count for Prices
WITH
uniquedates AS (
SELECT DISTINCT
date(nowtime), current_price, product_id
FROM
raw),
stats AS (
SELECT
*, MAX(current_price) as _max, MIN(current_price) as _min, AVG( current_price ) as _avg, COUNT( current_price ) as _count
FROM
uniquedates
GROUP BY
product_id)
SELECT
product.id,product.vendor,product.product_name,product.units,product.brand, stats._max, stats._min, stats._avg, stats._count
FROM
stats
INNER JOIN
product
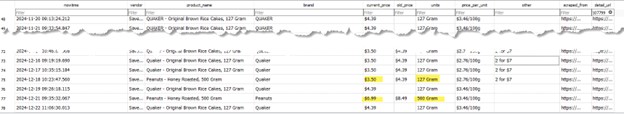
ON stats.product_id = product.id;Known Issues
What you see: 2 different price points for the same product, scraped on the same day (and sometimes at the same minute)
Examples: "100% Natural Origin Moisturizing Lip Balm, Cucumber Mint" and "Melatonin" by Sisu at Loblaws.
Cause: 2 distinct products are listed on vendor website with the exact same name and "unit size" Up until Sept. 30, 2024 there is no way to distinguish the two. After that, we have unique "detail_url" and "sku" values that help tell them apart.
What you see: multiple price entries (same price) for the same product on 1 day.
Magnitude: about 6,500 products impacted per day (as at Nov. 2, 2024).
Examples: "Mexican 4 Cheeze Blend Gluten Free Shreds" by Daiya at Metro.
Cause: Sometimes the exact same product appears in the scrape multiple times on the same day. This might be because of a product being listed under multiple categories. Or because the product is being advertised, so it shows up in unrelated categories/stickied on top of page on each page of a category.
Relevant SQL
SELECT product_id, COUNT(product_id) AS mycount FROM raw WHERE nowtime LIKE '2024-10-27%' GROUP BY product_id ORDER BY mycount DESC;
What you see: on the Save-On-Foods extract, some product name + brand combindations are mismatched with the value in detail_url. On extracts up until 2024-12-24
Magnitude: about 9 products a day, out of ~10k products. But each day, it can be a set of different products.
Examples: here's an example where the product name doesn't match the units - it indicates that something went wrong:
Cause: an issue during the web-scraping stage. Fixed as of the 2024-12-25 dataset, but not fixed retroactively.
Other grocery pricing resources:
- A tool that lets you query multiple Canadian grocers' prices at once, to compare prices (uses undocumented internal APIs).
- https://grocerytracker.ca/
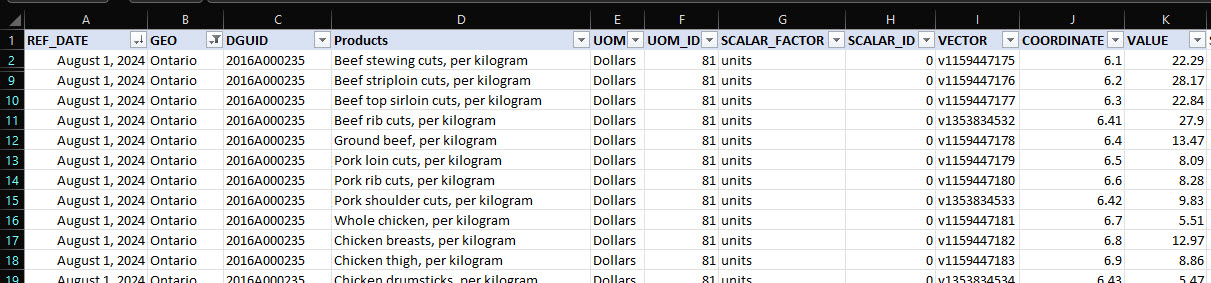
- Statcan data on "Monthly average retail prices for selected products", 110 staple products. Preview screenshot below.
- Statcan podcast "Eh Sayers" Episode 18 - Why Food Inflation Is Such A Hard Nut To Crack. Note that Statcan do their own web scraping + direct POS (Point of Sale) data collection from grocery merchants. This data is not available to the public.
- Competition Bureau Retail Grocery Market Study Report (June 27, 2023)
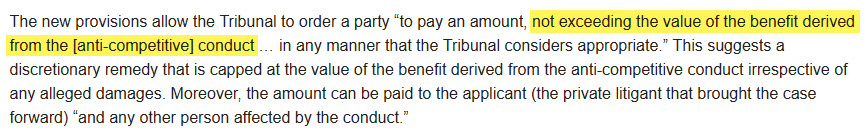
- Easier access to the Competition Tribunal is coming on June 20, 2025. But, appalingly, we're limiting the risks of anti-competitive abuses by capping the fines that guilty parties have to pay:
- On this blog: The story of Canada's bread prices in 1 chart
- On this blog: The time my tiny broccoli went viral on Linkedin
- On this blog: Every year, I buy a new car
- On Matt Stoller's BIG: Pepsi allegedly colludes with Walmart in the USA
- Sobeys and Dollarama make sure to not compete on Bread
